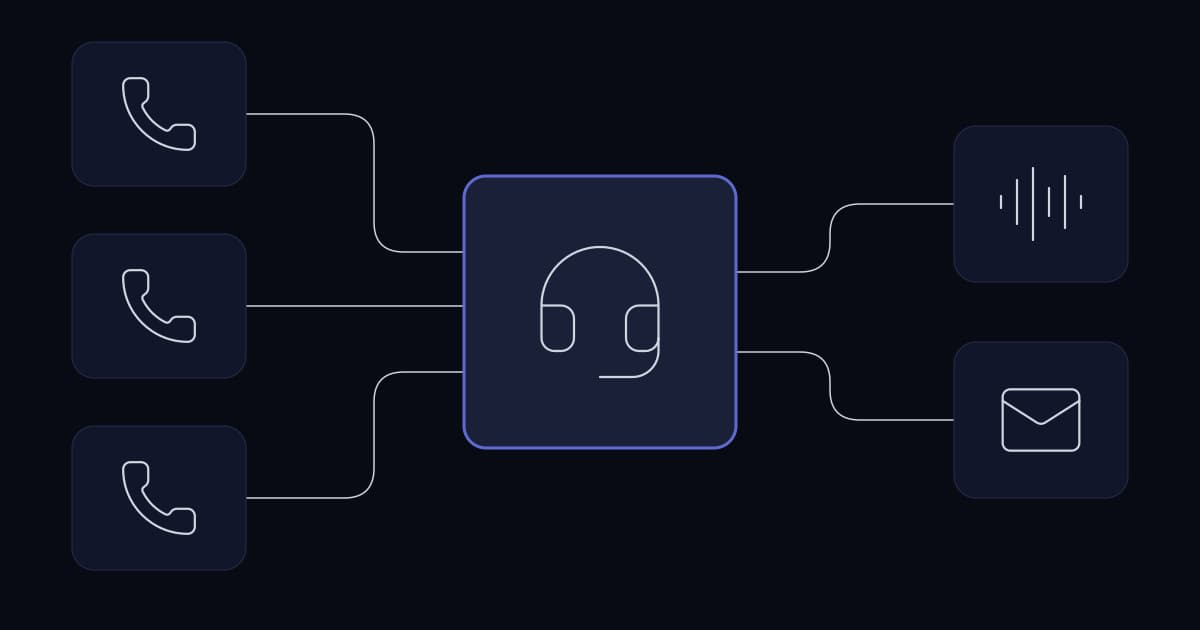
A call centre client was running several FreePBX deployments, each on its own server, each holding its own call detail records, recordings and voicemail. There was no single place to see what an agent had actually done in a shift — idle time, calls handled, recordings, voicemail — without logging into each server in turn.
The client's existing answer was Grafana. It is a reasonable first instinct: Grafana is free, capable, and already familiar to most infrastructure teams. It is also the wrong tool for this particular job, and the reason is worth stating precisely rather than dismissing Grafana in general, because Grafana is the right tool elsewhere on this site.
Why a metrics dashboard was not the right fit
Grafana visualises numeric time series well. It has no native concept of an agent, a call recording, or a voicemail. Getting those into a Grafana panel means representing them as data points on a chart, which is possible and is also the wrong shape for what a supervisor actually needs — to click an agent's name and hear the call, not to read a row in a table pointing at a file somewhere else.
The second mismatch is access control. A call centre needs an agent to see their own recordings and voicemail and nobody else's, a supervisor to see their team's, and an administrator to see everything. That is role-based access control scoped to individual records, which is not what a general dashboard tool is built to enforce — Grafana's permission model governs who can see which dashboard, not who can hear which specific recording.
Once both of those requirements are real — inline playback of sensitive audio, and per-record access control — the honest conclusion is that a dashboard is being asked to become an application. At that point building the application directly is less work than extending the dashboard to imitate one.
What the portal needed to show
- Per-agent idle time
- Incoming and outbound call counts
- Call recordings, played back inline
- Voicemail
- Complete per-agent stats — total calls handled, and the figures a shift report is built from
- One combined view across every FreePBX server, rather than one dashboard per server
The last item is the one that actually justified building something new. Any single FreePBX already exposes most of this for itself. What none of them do is combine with the others, because each server has no knowledge that the others exist.
No separate database, by design
The portal holds no database of its own. It reads from each FreePBX deployment's own data directly, at request time, rather than replicating it into a central store.
That is a deliberate trade rather than an oversight, and it is worth being honest about both sides of it.
| Read directly (chosen) | Replicate into a warehouse | |
|---|---|---|
| Source of truth | One, per server — the FreePBX itself | Two — the copy can drift from the original |
| Sensitive data footprint | Recordings and voicemail stay where they were created | A second copy of sensitive audio to secure and retain |
| Freshness | Always current | As current as the last sync |
| Load | Every dashboard view queries production servers directly | Production servers are queried once, on a schedule |
| History if a server purges old records | Lost when the source purges it | Preserved independently |
The load row is the real cost of this decision and it should not be understated. A report that scans a wide date range across several servers is querying systems that also have to keep taking calls, and that only stays safe if the queries are written carefully and the busiest reports are not run against the busiest servers at the busiest time of day.
The trade was made deliberately in favour of not holding a second copy of call recordings and voicemail. Those are about as sensitive as business data gets, and a replicated warehouse is a second place that data has to be secured, retained correctly, and eventually deleted on schedule. One source of truth per server, queried directly, was judged the smaller risk.
Combining several servers into one identity
Fetching data from several FreePBX servers is the easy part. The genuine difficulty in this class of system is that extension numbers are only unique within one server. Two different FreePBX deployments can both have an extension 105 belonging to two different people, and a dashboard that simply concatenates both servers' reports will merge them into one agent by accident.
The aggregation layer has to establish one agent identity that each server's local extension maps onto, before anything is summed, averaged, or compared across servers. Get this wrong and the dashboard produces numbers that are individually correct and collectively meaningless — an agent's idle time from one server added to a different agent's calls from another.
Authentication and access control
The portal authenticates with JWTs and authorises with role-based access control. The pairing is a common one for a React frontend talking to a Node.js API: the token carries identity and role, is verified on every request, and the backend decides what a given role may reach before any recording or voicemail is returned.
- Agent: their own recordings, voicemail and stats, nothing belonging to anyone else.
- Supervisor: their team's recordings, voicemail and stats.
- Administrator: the full combined view across every server.
The enforcement point matters more than the pattern name. Role checks have to sit on the server, on every request that returns a recording or a voicemail file, not only on which menu items the frontend chooses to render — a frontend-only check is not a control at all, since a request to the API directly bypasses it entirely.
Multi-tenancy, planned rather than retrofitted
The portal currently serves one client. The next step under consideration is serving others from it, and there are two genuinely different ways to do that, worth deciding deliberately rather than defaulting into one.
| Approach | What it means | Suits |
|---|---|---|
| Shared multi-tenant deployment | One running application, tenant isolation enforced in the data and access layer | Many smaller clients, lower operating cost per client |
| Separate deployment per client | Each client gets their own instance, no shared infrastructure | Fewer, larger clients, or clients with specific isolation requirements |
The shared path is the harder one to retrofit safely, because every query written before tenant isolation existed has to be re-examined for whether it could ever cross a tenant boundary. Deciding this before the first additional client is onboarded, rather than after, is what makes it safe rather than merely convenient.
What this replaces, and what it does not
This portal replaces per-server manual checking and a metrics tool being stretched to do a job it was not built for. It does not replace infrastructure monitoring — the FreePBX servers themselves still need the uptime, disk and certificate alerting described elsewhere on this site, and that job still belongs to a tool built for it.
Why was Grafana not sufficient for this?
Grafana visualises numeric time series and has no native concept of an agent, a call recording, or a voicemail, and its permission model governs which dashboards a user can see rather than which individual recordings they may hear. Once the requirement includes inline playback of sensitive audio and per-record role-based access control, the dashboard is effectively being asked to become an application, and building the application directly is less work than extending a dashboard to imitate one.
Why does the portal have no database of its own?
Because each FreePBX server already holds its own call detail records, recordings and voicemail, and replicating that into a second store would create a second source of truth that can drift from the original, plus a second place holding sensitive audio that has to be secured and retained correctly. Reading directly from each server at request time keeps one source of truth per server, at the cost that every report queries production systems directly rather than a pre-aggregated copy.
What is the hardest part of combining several FreePBX servers into one dashboard?
Not fetching the data — establishing one consistent agent identity across servers before anything is aggregated. Extension numbers are only unique within a single FreePBX, so two servers can both have an extension 105 belonging to different people. A dashboard that combines reports without resolving this will produce numbers that are individually correct and collectively meaningless.
How does the portal control who can hear which recordings?
Through JWT authentication paired with role-based access control enforced on the server. Agents can reach only their own recordings, voicemail and stats; supervisors reach their team's; administrators reach the full combined view. The check has to sit on the API for every request that returns a recording or voicemail file — a check that exists only in what the frontend chooses to display is not a control, since the API can be called directly.
Should a multi-client version be one shared deployment or separate instances per client?
Both are legitimate and the choice should be made deliberately before the first additional client is onboarded, not defaulted into afterwards. A shared multi-tenant deployment costs less to operate per client but is harder to retrofit safely, since every query written before tenant isolation existed has to be checked for whether it could cross a tenant boundary. Separate deployments per client avoid that risk entirely at the cost of running and maintaining more infrastructure.
Sources and further reading
- Giving a shared FreePBX estate real multi-tenant isolation— the same shared-versus-separate decision, worked through for a hosted PBX platform
- Automating FreePBX call reporting across two MySQL servers— combining more than one FreePBX server's data, solved with scheduled workflows rather than a live portal
- Reaching a private database from shared hosting without opening it— the access-path problem this portal avoids by holding no database of its own
- Call recording: the obligations nobody checks— what an archive of recordings and voicemail commits you to
- Access control and offboarding— the account and role model underneath the RBAC design here
- Grafana dashboards that get used— where Grafana remains the right tool, and the discipline that makes it useful
- Building reliable call centre infrastructure— the wider stack this dashboard reports on
- VICIdial in production— database growth under reporting load, in a related platform
- RFC 7519: JSON Web Token— the token format used for authentication
- OWASP Authorization Cheat Sheet— server-side enforcement of role checks, including the frontend-only check pitfall named above
- NIST: Role Based Access Control— the RBAC model this portal's agent, supervisor and administrator roles follow
Services This Relates To
Written by KYCONNECTS Engineering. Client names are withheld under confidentiality.