The model API returns successfully, the worker reports no exception and the dashboard is green. A supervisor still cannot use the report because its evidence links point to old records.
This is an observability gap. Infrastructure health shows that components are running. AI application observability must also show whether the workflow reached a usable outcome and where the work became unreliable.
Trace the business job across retrieval, model calls, tool operations, validation and human review. Keep enough metadata to explain the result without making routine telemetry a copy of every confidential prompt and document.
Begin with the business job identifier
Assign an identifier when the application accepts the task. Carry it through asynchronous workers and downstream calls so that support can follow one piece of work.
Record separate identifiers for attempts and consequential operations. A retried model request belongs to the same business job, but it is a different attempt. An external action needs an identity that supports reconciliation and duplicate detection.
Do not use a provider's request ID as the only job identifier. The job may involve several calls, multiple tools and a manual fallback before it completes.
Capture meaningful states
Useful states include accepted, retrieving, generating, validating, waiting for review, completed, cancelled and failed. Distinguish a safe refusal from a technical error and an unknown action result from a confirmed failure.
The states should correspond to application events rather than a model's narrative. “I am finished” is not a reliable completion event if the result failed validation or never reached the target system.
Use traces to connect the steps
OpenTelemetry describes traces as records of how a request moves through an application, with spans representing units of work. That structure is useful for AI workflows because latency and failure often occur outside the model call itself.
Reference
- OpenTelemetry: Traces— The trace-and-span model for following work across services.
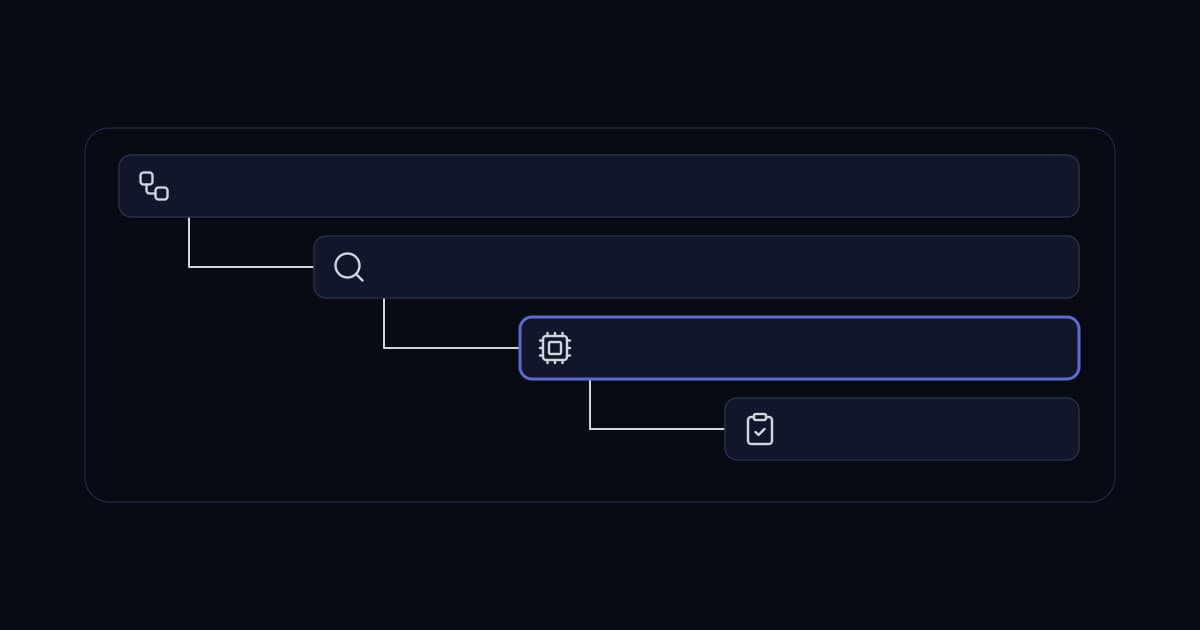
A proposed trace might contain spans for source lookup, permission filtering, model request, schema validation and draft storage. A tool call can have its own span with an operation name and outcome.
For jobs waiting on a person, store a durable relationship between the job and the later review event. The exact trace mechanism may vary with the instrumentation and duration, but the operational record must preserve that connection.
Measure four different kinds of health
First, measure availability: whether the feature can accept work and reach its dependencies. Second, measure timeliness: whether useful output arrives before the business deadline.
Third, measure process correctness: whether required validation and authorization steps completed. Fourth, measure accepted quality: whether a reviewer or downstream check accepted the result.
These measures are related, but they are not interchangeable. A fast invalid draft is not a timely completed task. A provider timeout followed by successful manual handling is not the same customer impact as a lost request.
| Signal | Example question | Likely owner |
|---|---|---|
| Queue age | Is work waiting too long to start? | Application operations |
| Retrieval outcome | Was permitted evidence available? | Data and search owners |
| Model latency | Did inference consume the time budget? | Integration owner |
| Validation failure | Was the result structurally usable? | Application engineering |
| Review correction | Did the output need substantive repair? | Business process owner |
| Action reconciliation | Is the downstream effect confirmed? | Transaction owner |
Record metadata before content
Routine telemetry can include model identifier, configuration version, input-size category, duration, token usage where available, tool name and failure category. It often does not need the full input or output.
Source record identifiers may themselves be sensitive. Apply the organization's classification and access rules, and use appropriately scoped or pseudonymous references where useful.
Avoid collecting access tokens, authorization headers and raw connection strings. A telemetry platform can otherwise become an easier route to secrets than the application it monitors.
Keep content capture exceptional
Sometimes a quality investigation needs the exact input and output. Use an explicit diagnostic path with a defined purpose, restricted access and retention.
Make the collection visible to the responsible team. Do not enable full-content logging indefinitely because it helped during the first incident.
Redaction must be tested against real data shapes. It can miss sensitive material in attachments, nested fields or unexpected error messages. Data minimization remains useful even when a redaction tool exists.
Classify failures so someone can act
A single “AI failed” counter provides little guidance. Separate authentication failure, permission denial, missing source, provider limit, timeout, invalid output, unsupported claim and downstream execution uncertainty.
Each category should have an owner and an expected response. A malformed source record may belong with the data team. A repeated tool-contract failure belongs with the integration team. A business rule conflict needs the process owner.
Preserve the provider's relevant error code in protected diagnostic detail, but translate it into a stable application category for operations. That keeps dashboards useful when a provider changes wording.
Track cost without exposing the prompt
Attach measured usage and billed-service categories to the job. Aggregate by feature, task class and approved business dimensions.
Do not put customer names, raw questions or document text into metric labels. High-cardinality labels can also make a metrics system expensive and hard to query.
Use traces or controlled event records for detailed investigations and metrics for aggregate trends. The distinction helps the monitoring stack remain usable as volume grows.
Reference
- AI cost per completed task— Connect usage records to accepted business outcomes.
Observe tool behaviour separately from model behaviour
A model may request a correct operation that fails because the downstream API is unavailable. It may also request an invalid operation that the server correctly rejects.
Record both the proposed tool operation and the enforcement outcome without confusing a blocked request with a successful action. This makes security controls visible during ordinary operation.
For consequential tools, record the confirmed downstream identifier. If the result is unknown after a timeout, expose that state to the reconciliation process and support team.
Watch loops and repeated work
A job repeatedly fetching the same record or retrying the same invalid operation can consume resources without making progress. Detect repeated operation patterns and enforce the workflow's budget.
Do not rely only on a maximum execution time. A short, intense loop can be costly, while a long job waiting for review may be behaving correctly.
Alert on business impact
A temporary increase in model latency may not matter for a nightly report. The same increase can make a live support feature unusable.
Define alerts around task deadlines, queue age, confirmed lost work and unsafe execution states. Use lower-priority investigation signals for changes that need attention but do not require waking someone.
A rising correction rate may deserve an editorial or product review rather than an infrastructure page. The response should fit the failure.
Connect production observation to evaluation
Production telemetry can reveal new failure categories and changing input patterns. Use those findings to improve a controlled evaluation set, subject to appropriate data permissions and sanitization.
Do not automatically copy every production prompt into a test dataset. Retention and reuse require their own controls.
Keep evaluation results separate from live service metrics. An offline score estimates behaviour on a selected set; production observation describes the workload actually encountered. Together they support a better decision than either alone.
A hypothetical reporting workflow
A weekly operations report collects ticket data, asks a model to draft an explanation and places the result in a review queue. The provider latency remains stable, but review delays increase.
Job traces show that retrieval completes normally and drafts arrive on time. Review records show a growing number of unsupported causal claims after a new source field was introduced.
The team corrects the evidence package and adds representative cases to evaluation. It does not scale the model workers, because compute capacity was not the problem.
In a later incident, the retrieval service becomes slow. The same observability design distinguishes that failure and directs the response to the appropriate owner.
Build a useful support view
For one job, support should see the requested feature, current state, source versions, relevant attempts and whether any external action is uncertain. Sensitive content should require the appropriate separate access.
Provide a safe way to retry an eligible task, cancel stale work and open an investigation. A generic “rerun everything” button can create duplicate actions.
Include the configuration history. A support engineer investigating a complaint should know whether the job used the current model route or an earlier version.
Retain what you can explain
Set retention according to operational needs and data sensitivity. A cost aggregate can often outlive a detailed trace. A content sample may need a shorter period and more restricted access.
Document how trace data is deleted or aggregated and how an investigation hold is handled. The observability system is part of the data architecture, not an exemption from it.
Follow one task from request to business result
Consider an assistant asked to prepare a support response from a knowledge base and a customer record. A trace should show the request entering the application, the authorized retrieval, the model call, the validation step and the draft becoming available. If the employee sends the response, record that as a separate business action.
Use identifiers that let an operator follow this path without collecting the full conversation in every system. A task identifier can connect the workflow history to a trace. A record reference can connect the trace to a CRM action. Apply access restrictions wherever these references could reveal confidential relationships.
When the draft is wrong, the operator should be able to ask a precise question. Was the source missing? Did retrieval return an outdated document? Did the model ignore useful evidence? Did a later formatting step remove an important qualification? A single duration chart cannot answer these questions.
The trace should also reveal work that did not reach the model. Authorization denials, retrieval timeouts and abandoned approvals are part of the application experience. Excluding them produces an attractive but incomplete reliability picture.
Design sampling around the investigation
Storing every payload is rarely necessary for useful observability. Decide which structural events must always be recorded and which content samples require additional protection. Record sampling decisions so investigators know what evidence may be absent.
A successful task and a failed task may need different diagnostic detail. However, collecting additional failure data should still follow the application's privacy policy. An exception is not permission to dump credentials, document bodies or unrestricted user messages into a log.
Retain the configuration needed to interpret the record. A model name alone may be insufficient when prompts, retrieval settings, tool schemas or approval rules changed. Link the task to an application release or configuration version that can be inspected later.
Give each dashboard an operating decision
Before adding a chart, state who will use it and what action it supports. An engineering view might help identify a slow dependency. A service owner's view might show tasks awaiting intervention. A financial view might compare accepted outcomes with metered usage.
Avoid making the same dashboard serve every audience. Detailed traces can overwhelm an operations manager, while a high-level success rate can hide the evidence an engineer needs. Keep definitions consistent across views even when the level of detail changes.
For alerts, describe the customer consequence and first diagnostic step. A notification that a provider returned an error is less useful than one explaining that a named workflow has accumulated tasks beyond its permitted wait time. The second connects a technical signal to an operating responsibility.
Start an observability implementation with one representative workflow and a real investigation question. Instrument enough of the path to answer that question, then verify the answer using a controlled failure. KYCONNECTS can help connect application telemetry, infrastructure monitoring and business task records without treating unrestricted payload logging as the default.
The final acceptance test is practical: can the responsible person find an affected task, identify its last confirmed state and choose a safe recovery action? If that still requires guessing, the dashboard is not yet providing the evidence the service needs.
Operational questions
Is provider uptime enough to monitor an AI feature?
Provider uptime does not establish that the complete application produced usable work. Observe retrieval, validation, queues, tools and acceptance as well as the model endpoint.
Should prompts and responses always be logged?
Routine full-content logging can create unnecessary sensitive-data exposure. Start with operational metadata and use controlled content capture when a defined investigation requires it.
How should an incorrect answer be investigated?
Identify the job, source versions, configuration and validation path. Determine whether the problem came from evidence, retrieval, model output, business rules or downstream execution before choosing a fix.
Reference
- Monitoring and automation services— Build operational visibility around business workflows.
- Infrastructure monitoring that works— Connect application signals to the wider service.
- Enterprise AI data retention— Include telemetry in the complete data lifecycle.
Discuss your requirements
- Plan AI application monitoring— Identify a workflow, a recent failure and the evidence your support team needs to investigate it.
Services This Relates To
Written by KYCONNECTS Engineering. Client names are withheld under confidentiality.