An IT roadmap for a growing business
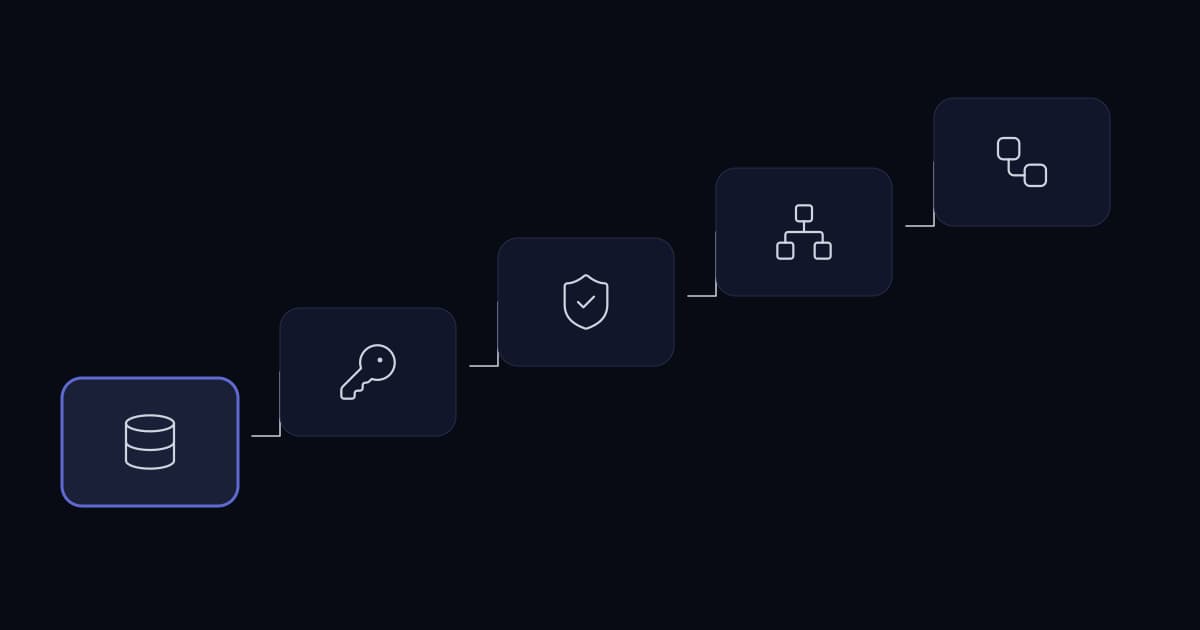
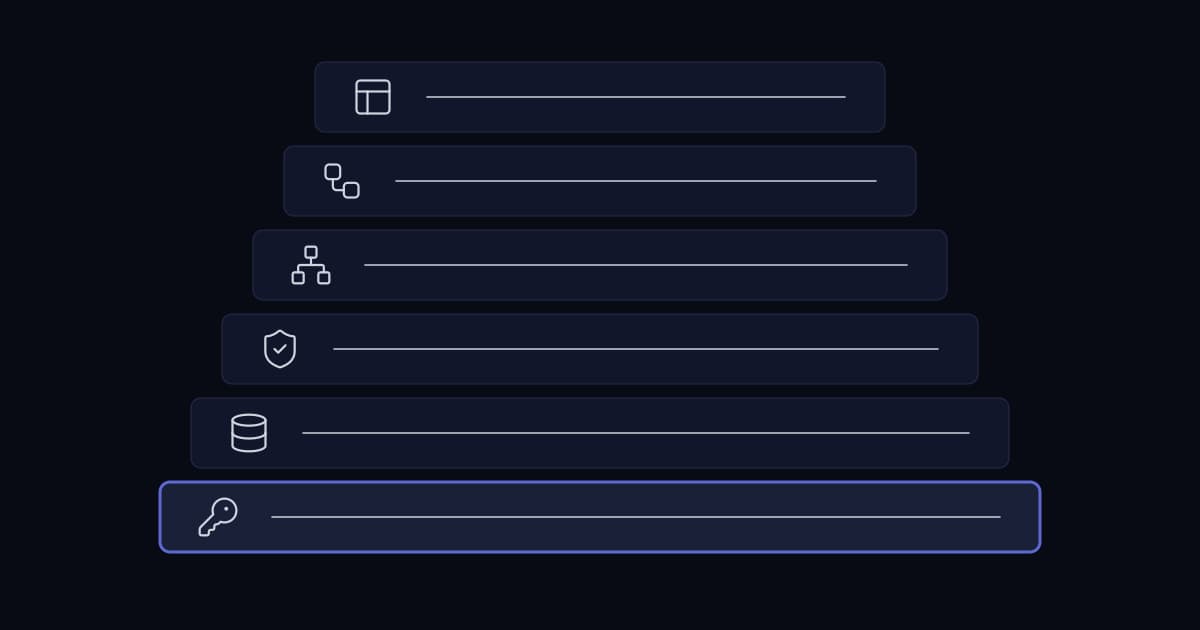
The order matters more than the list. Most IT programmes fail not because the wrong things were chosen but because they were attempted in an order where each depended on something that had not been done yet.
Engineering write-ups on it support from deployments KYCONNECTS has run, with the reasoning behind each approach.
The order matters more than the list. Most IT programmes fail not because the wrong things were chosen but because they were attempted in an order where each depended on something that had not been done yet.
What a business of thirty to three hundred people actually needs, layer by layer, with the decision each layer turns on. Not a shopping list — a map of which choices are consequential and which are not.
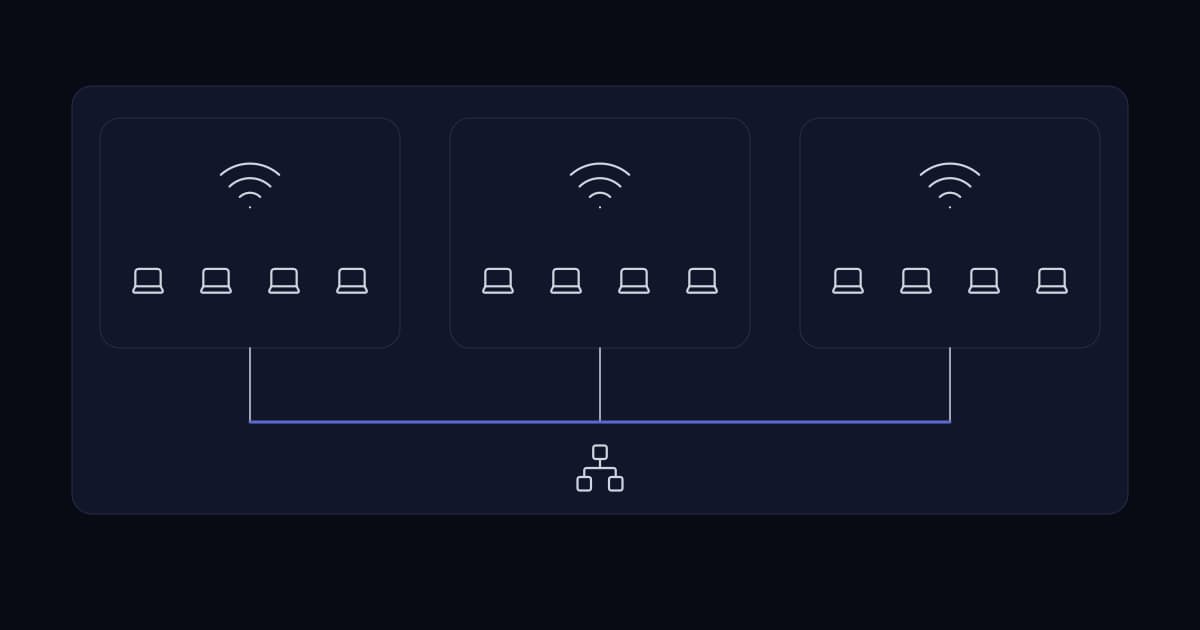
Education IT is shaped by three things no ordinary business faces: everyone arrives at once, the user population turns over almost entirely each year, and a large part of it is actively curious about the network.
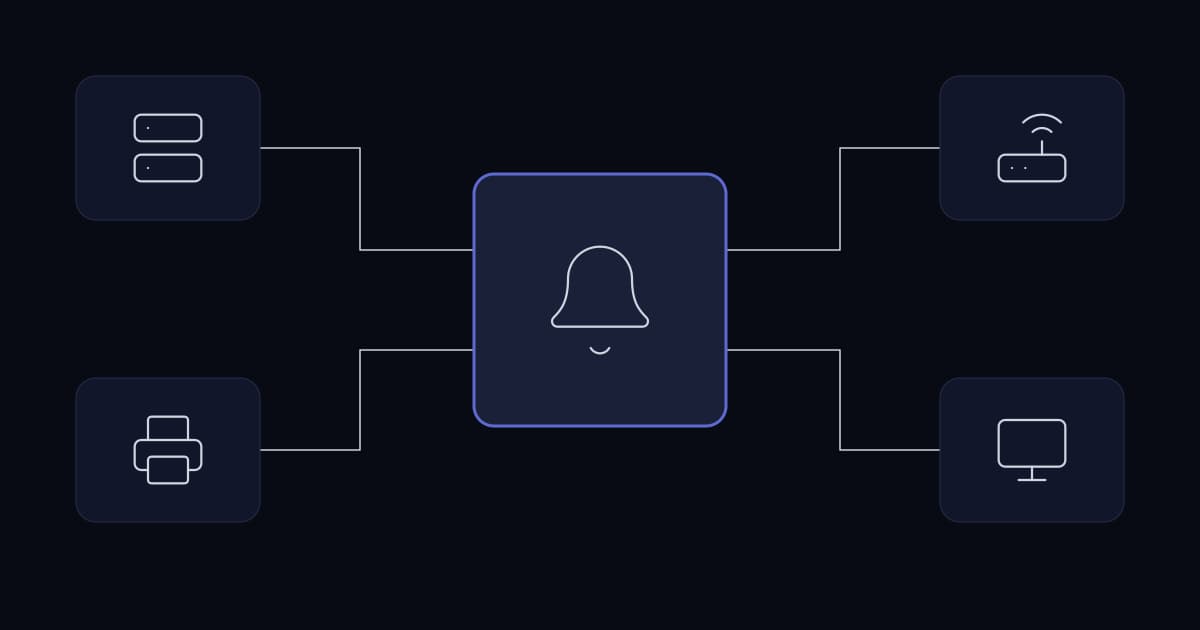
Zabbix and Prometheus are both described as monitoring and are built for different jobs. Zabbix is an integrated system that arrives knowing what a server, a switch and a printer are. That difference is what should decide which one a growing business runs.
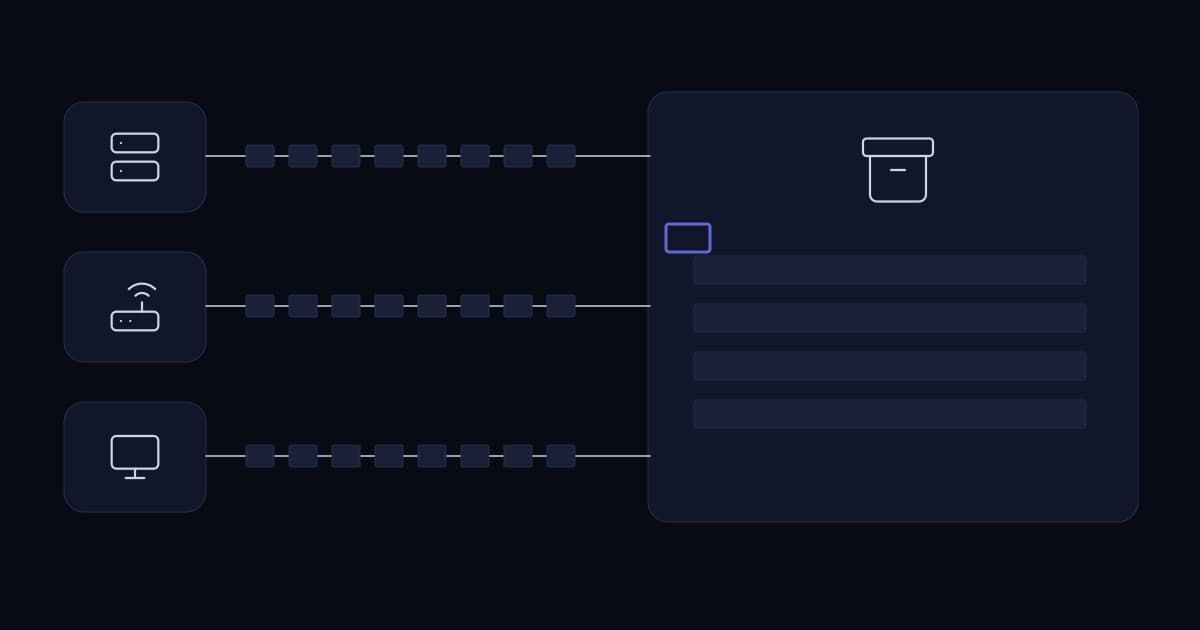
Logs answer the questions metrics cannot, and they are the first thing an attacker deletes. Loki makes keeping them affordable by indexing labels rather than log text — which is exactly why the labels have to be chosen carefully.
Prometheus is the default metrics store for good reasons, and it has a documented limitation businesses run into by using it for the wrong job. Knowing what it is not for is more useful than another installation guide.
Most server monitoring watches CPU, memory and disk, which are the three things least likely to be the actual problem. The signals that predict outages are duller and are usually not collected at all.
Most dashboards are built to show everything, which is why nobody looks at them. A dashboard is a diagnostic tool with one question to answer, and the discipline that makes it useful is deciding what to leave off.
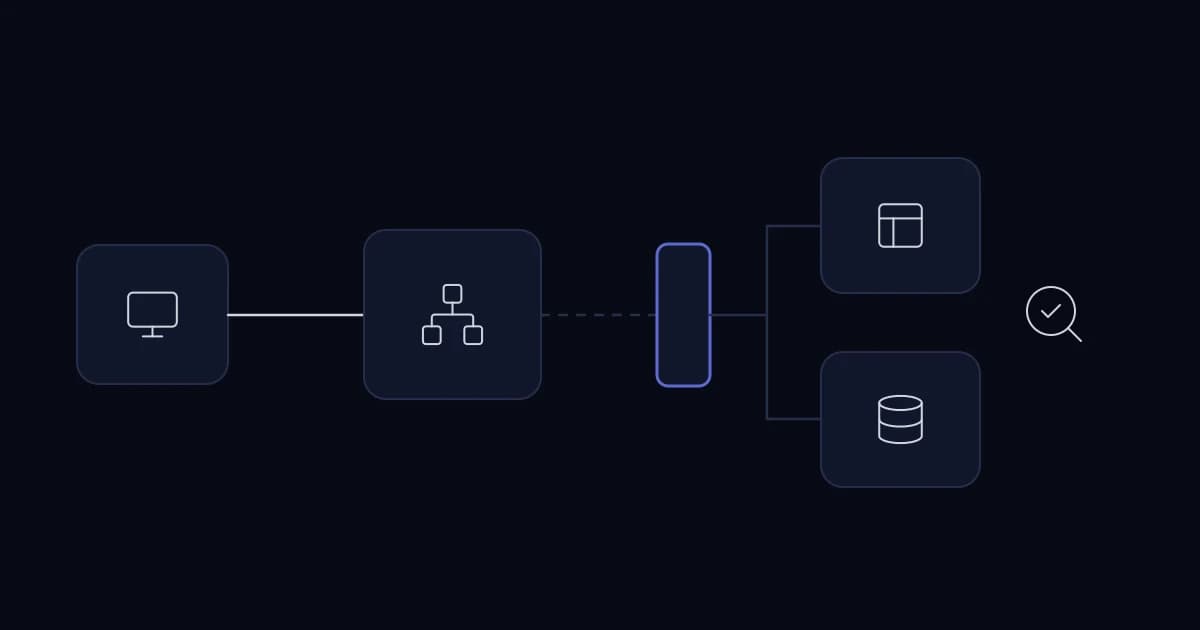
Most monitoring tells you a server is up while customers cannot use it. The difference between a dashboard and a control is whether it watches what users experience or what machines report.
We typically respond within 4–8 business hours.