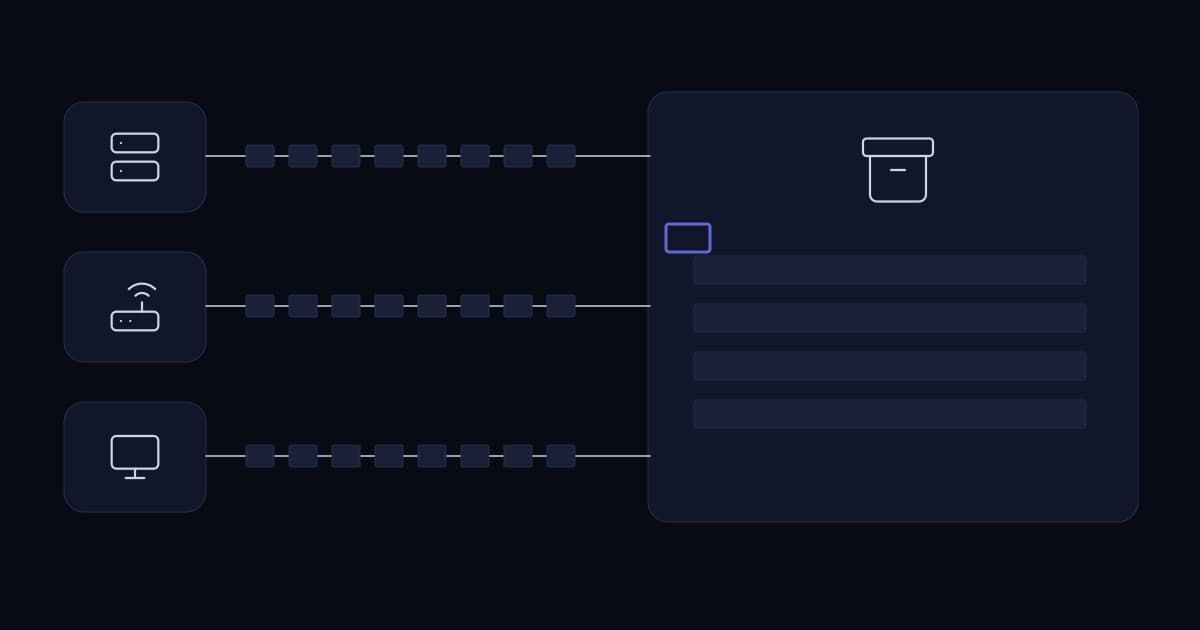
Metrics tell you that something is wrong. Logs tell you what happened. Both are needed, and most growing businesses have some form of the first and nothing systematic for the second — logs sit on the machines that produced them, rotate away after a week, and are consulted by logging into the server.
That arrangement fails in two specific situations, and both are the situations where logs matter most.
- When the machine is gone. A failed server, a rebuilt container or a terminated instance takes its logs with it, and the logs from just before the failure are the ones you needed.
- When the machine was compromised. Logs on a compromised host are logs the attacker can edit or delete, and doing so is a standard step rather than an unusual one.
Centralising logs addresses both. The reason it often does not happen is cost — traditional log systems index everything and the storage and compute required grows with volume in a way that gets expensive quickly.
What Loki does differently
Loki takes a deliberately different approach to indexing. Rather than indexing the full contents of every log line, it indexes only metadata about the logs as a set of labels for each log stream. The log data itself is compressed and stored in chunks in an object store such as S3 or Google Cloud Storage.
The consequence is directly commercial: a small index plus bulk data in cheap object storage makes Loki less expensive to operate than systems that index every line, and the design scales from small deployments upward.
The trade-off is equally direct, and the documentation is explicit about it. Because Loki relies on labels to locate the relevant log streams rather than performing full-text search, a quality set of labels is essential. Get the labels wrong and queries either return too much or cannot find what you need.
| Consequence | Implication |
|---|---|
| Only labels are indexed | Queries must narrow by label first, then filter text |
| Log data sits in object storage | Retention is cheap enough to be generous |
| No full-text index | Searching all logs for one string is expensive |
| Labels define streams | Label design is the design decision that matters |
| Same query language family as the metrics side | One skill covers both if you already run Prometheus |
Label design, which is the whole job
Labels should identify where a log came from, using values from a small known set. They should never carry anything unbounded.
| Good labels | Never labels |
|---|---|
| Environment — production, staging | Request or trace identifier |
| Application or service name | User identifier or email address |
| Host or instance | IP address of the client |
| Log level | Timestamp |
| Job or component | Any value derived from user input |
The reason is the same cardinality problem that affects the metrics side. Every distinct combination of label values creates a separate stream, so a label carrying a request identifier creates a stream per request. The system degrades and the failure is difficult to unwind because historical data carries the labels too.
The information you want to search on — the user, the request, the error text — belongs in the log line itself, where the query filters it after the labels have narrowed the search to the right streams. That is the pattern the design intends, and it is the one that keeps it fast.
What to send, and what to leave out
Centralising everything is neither necessary nor advisable. Two categories are worth collecting deliberately.
- Security-relevant logs: authentication successes and failures, privilege changes, administrative actions, firewall events. These are what an investigation needs and what an attacker most wants to remove.
- Application logs from systems the business depends on, at a level that would let someone reconstruct what happened during an incident.
And one category to be careful about. Logs frequently contain material that should not be casually retained or widely readable — personal data, tokens, session identifiers, and occasionally credentials written by an application in a debug path.
- Filter or redact sensitive values before shipping rather than after storing.
- Apply retention deliberately, since a log archive is subject to the same obligations as any other store of personal data.
- Restrict who can query it. A central log store is unusually revealing about the whole business.
- Remember that a credential appearing in a log is a leaked credential and needs rotating, not just deleting.
Making it useful during an incident
A log platform that is only touched during incidents will be unfamiliar during incidents, which is when familiarity matters most.
- 1
Get time right everywhere
Correlating events across systems requires their clocks to agree. Clock drift makes a central log store substantially less useful and the problem is invisible until you need the correlation.
- 2
Ship structured logs where you control the application
Fields are filterable; a formatted sentence is not. This is a small change at the point of writing and a large difference at the point of querying.
- 3
Retain long enough to matter
Intrusions are frequently discovered long after they begin. Retention measured in days answers questions about last night and nothing about last quarter.
- 4
Write the queries before you need them
A handful of saved queries — failed authentications by source, administrative actions, errors by service — turn a search problem into a lookup during an incident.
- 5
Alert on log patterns that indicate real problems
A spike in authentication failures, or a specific error appearing. Sparingly, and following the same rule as any alert: it must have an action.
- 6
Confirm logs are still arriving
A shipper that stops is a silent blind spot, and absence of logs looks identical to absence of problems.
The last is the failure mode this class of system is most prone to. Nothing about a working log platform distinguishes a quiet system from one that stopped receiving data, unless something specifically watches for it.
Why do logs need to leave the machine that produced them?
For two reasons that are exactly the situations where logs matter most. A failed server, rebuilt container or terminated instance takes its logs with it, and the logs from immediately before the failure are the ones needed. And logs on a compromised host are logs the attacker can edit or delete, which is a standard step in an intrusion rather than an unusual one. Centralising addresses both.
How is Loki different from other log systems?
It indexes only metadata about logs as a set of labels for each log stream, rather than indexing the full contents of every line. The log data itself is compressed and stored in chunks in an object store such as S3 or Google Cloud Storage. The small index plus cheap bulk storage makes it less expensive to operate than systems that index everything, which is what makes generous retention affordable.
Why does label design matter so much in Loki?
Because Loki relies on labels to locate the relevant log streams rather than performing a full-text search, so a quality set of labels is essential. Labels should identify where a log came from using values from a small known set — environment, service, host, level. Anything unbounded, such as a request identifier or user email, creates a separate stream per value, degrades the system, and is difficult to unwind because historical data carries the labels too.
What should be searched on if not labels?
The log line itself. Labels answer where a log came from; the message answers what happened. Queries narrow by label to the relevant streams, then filter the text within them. If you find yourself wanting to add a label so that something is searchable, that value belongs in the message instead — which is also why structured logging is worth the small change at the point of writing.
What is the most common failure of a centralised logging system?
A shipper that stops, creating a silent blind spot. Nothing about a working log platform distinguishes a quiet system from one that has stopped receiving data, so the absence of logs looks identical to the absence of problems. Something must specifically alert on logs no longer arriving from a source that should be producing them.
Sources and further reading
- Infrastructure monitoring that works— the metrics side, and why both are needed
- Prometheus for business infrastructure— the same cardinality problem, on the metrics side
- Grafana dashboards that get used— where these logs are queried from
- Zabbix for business infrastructure— the device-estate monitoring this complements
- A cybersecurity checklist for growing businesses— control 8, audit log management, in context
- Data retention and archiving for growing businesses— the obligations a log archive carries
- Secrets management for business systems— why a credential in a log needs rotating rather than deleting
- Loki overview — Grafana Labs— the label-only indexing model and object storage design cited above
- Loki documentation— deployment, LogQL and label best practice
Services This Relates To
Written by KYCONNECTS Engineering.