Prometheus has become the default way to collect infrastructure metrics, and for a growing business it is a reasonable default. It is open source, it runs on modest hardware, it has exporters for effectively everything, and it is what most monitoring documentation now assumes.
What is less commonly explained is the shape of the thing — how it collects, what that implies operationally, and the one job the project's own documentation says it should not be used for. Getting those right at the start avoids the rebuild that follows getting them wrong.
It pulls, and that decides several things
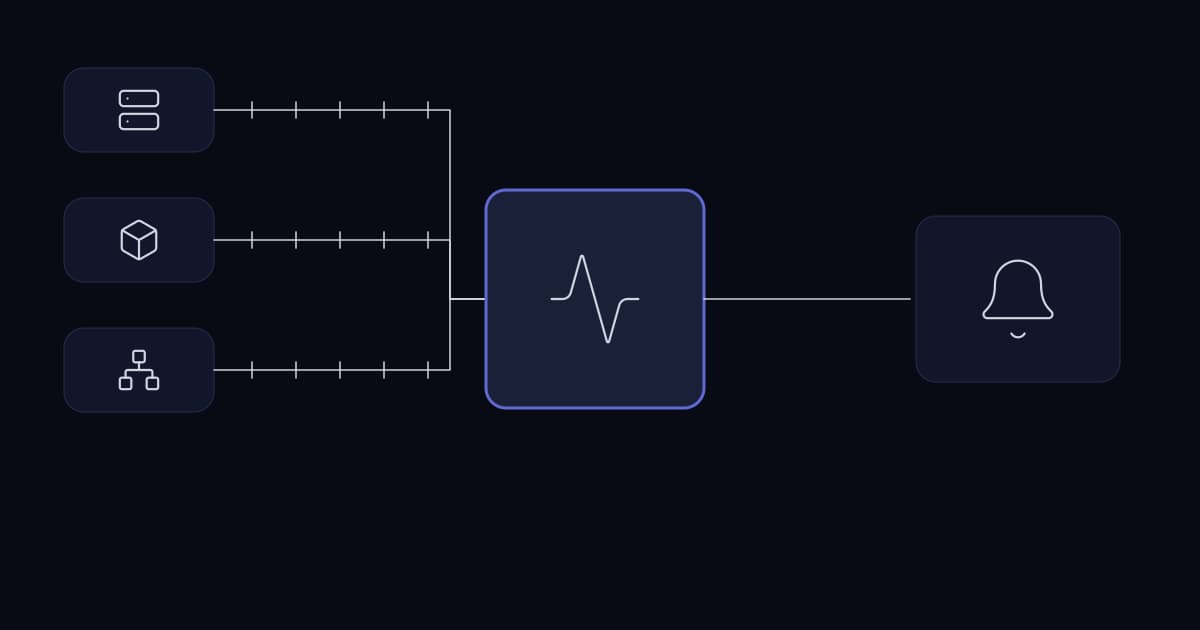
Prometheus collects by scraping HTTP endpoints on a schedule rather than by receiving data pushed to it. Pushing is supported through an intermediary gateway, but the model is pull.
That choice has practical consequences worth understanding before designing around it.
| Consequence | Why it matters |
|---|---|
| Prometheus must reach the target | Firewalls and network segmentation have to permit it — a segmented estate needs this designed in |
| A target that is down is visibly down | Failure to scrape is itself a signal, which push-based systems get less cleanly |
| Targets need discovering | Static lists go stale; service discovery is what keeps coverage honest |
| Short-lived jobs are awkward | A job that finishes before the next scrape is never seen — this is what the push gateway exists for |
| Scrape interval bounds resolution | You cannot see detail finer than the interval, retrospectively or otherwise |
The first row is the one that catches segmented estates. A monitoring server that cannot reach a segment monitors nothing in it, and the failure is silent unless something alerts on the absence of targets rather than on the targets themselves.
The second row is genuinely valuable and worth exploiting. Because a scrape failure is a first-class event, absence is detectable — a machine that stops responding is immediately visible, without needing the machine to report its own failure.
What it is explicitly not for
The Prometheus documentation is unusually direct about a limitation, and it is worth quoting the substance because businesses run into it by trying to use one system for two jobs.
The project states that if you need 100% accuracy, such as for per-request billing, Prometheus is not a good choice, because the collected data will likely not be detailed and complete enough. It recommends a different system for that purpose.
This follows directly from the pull model. Data is sampled at intervals, not recorded per event, so what is stored is a series of observations rather than a complete ledger. That is exactly right for answering how the system is behaving and exactly wrong for answering how many units a customer consumed.
- Use it for: infrastructure health, application behaviour, capacity trends, alerting on symptoms.
- Do not use it for: billing, per-transaction audit, regulatory records, or anything where a missing sample is a correctness failure rather than a gap in a chart.
Designing metrics that survive growth
Prometheus identifies time series by a metric name plus key-value labels. That dimensional model is what makes it powerful, and it is also where estates get into trouble.
Every distinct combination of label values creates a separate time series. A label with a small fixed set of values costs almost nothing. A label carrying something unbounded — a customer identifier, a request path with parameters, an email address, a session identifier — multiplies the series count without limit.
This is called cardinality, and high cardinality is the failure mode that takes down monitoring systems. It degrades gradually, then abruptly, and it is difficult to unwind afterwards because the historical data carries the labels too.
- 1
Label with things that have a small, known set of values
Environment, service, instance, status code, method. Not identifiers, not free text, not anything derived from user input.
- 2
Follow the project's naming conventions
Consistent naming and base units make queries writable by people who did not create the metric, which is what makes monitoring a team capability rather than one person's.
- 3
Measure business outcomes, not only resources
Orders completing and calls connecting matter more than CPU. Resource metrics arrive automatically from exporters; outcome metrics have to be deliberately instrumented, which is why they are the ones missing.
- 4
Decide retention before you need it
Prometheus stores locally by default with a finite retention. If you need long-range capacity trends, that requires either a longer retention with the storage to match, or a remote-write destination — decided before the data you wanted is gone.
Alerting: rules here, routing elsewhere
Prometheus evaluates alerting rules; Alertmanager handles the resulting alerts — grouping, silencing, deduplication and delivery. The separation is deliberate and it matters for how a small team operates.
- Grouping means one incident affecting forty machines produces one notification rather than forty. Without it, a real incident buries itself.
- Silencing means planned maintenance does not page anyone, which is what prevents the habit of ignoring alerts during changes — a habit that persists after the change.
- Deduplication means a redundant pair of Prometheus servers does not double every alert, which is what makes running that redundancy practical.
The rule content itself should follow the symptom principle: alert on what the business notices, and put the causes on a dashboard for whoever is investigating. That reasoning is covered in the dashboards article rather than repeated here.
What it costs to run
For a growing business the honest position is that Prometheus is inexpensive to run and not free of effort.
- It is a server to patch, back up and monitor. Monitoring that is itself unmonitored fails silently, which is the worst failure mode available to it.
- A single instance is a single point of failure for your visibility. That may be acceptable; it should be a decision.
- Exporters need deploying and maintaining alongside the things they measure, and an exporter that stops is a blind spot rather than an error.
- The initial configuration is a day; keeping targets, rules and dashboards current as the estate changes is ongoing and is the part that gets dropped.
Where none of that can be staffed, a hosted monitoring service is the honest alternative and the cost difference is usually smaller than it appears once the operational time is counted.
Is Prometheus pull or push based?
Pull. It collects time series by scraping HTTP endpoints on a schedule, though pushing is supported through an intermediary gateway for short-lived jobs that finish before a scrape would occur. The pull model means Prometheus must be able to reach its targets, which requires deliberate design in a segmented network, and it makes a failed scrape a first-class signal — a machine that stops responding is immediately visible without needing to report its own failure.
Can Prometheus be used for billing?
No, and the project's documentation states this directly: if 100% accuracy is required, such as for per-request billing, Prometheus is not a good choice because the collected data will likely not be detailed and complete enough. It samples at intervals rather than recording every event, which is correct for understanding system behaviour and wrong for producing a ledger. Billing requires a per-transaction event log with durability guarantees a monitoring system deliberately does not provide.
What is cardinality and why does it cause problems?
Prometheus identifies each time series by a metric name plus its key-value labels, so every distinct combination of label values creates a separate series. Labels with a small fixed set of values cost almost nothing; labels carrying unbounded values — customer identifiers, session identifiers, request paths with parameters — multiply series without limit. High cardinality degrades the system gradually and then abruptly, and it is hard to unwind because historical data carries the labels too.
What is Alertmanager for?
Prometheus evaluates alerting rules; Alertmanager handles the resulting alerts through grouping, silencing, deduplication and delivery. Grouping means an incident affecting forty machines produces one notification rather than forty, so a real incident does not bury itself. Silencing means planned maintenance does not page anyone. Deduplication means running a redundant pair of Prometheus servers does not double every alert.
How long does Prometheus keep data?
It stores locally with a finite retention period by default, which is adequate for operational alerting and short-range investigation but usually not for long-range capacity planning. Extending it requires either a longer local retention with storage to match, or configuring remote write to a long-term store. Either way the decision has to be made before the period you later want to analyse has already passed.
Sources and further reading
- Infrastructure monitoring that works— what to monitor and how to alert, above the tooling
- Grafana dashboards that get used— the visualisation layer over this data, and the symptom principle
- Server health monitoring— the specific signals worth collecting from every machine
- High availability for business systems— why detecting a failure and surviving it are separate problems
- Network segmentation for growing businesses— the reachability constraint the pull model imposes
- Prometheus overview— the data model, pull collection and the accuracy limitation quoted above
- Prometheus metric and label naming conventions— the naming discipline that makes metrics queryable by people who did not create them
- Alertmanager documentation— grouping, silencing, deduplication and routing
Services This Relates To
Written by KYCONNECTS Engineering.